By Jaclyn Mosher, November 14, 2017

SmartFence WebApp Update: The TattleTale Graph is Here!
Announcing the newest feature of our exclusive SmartFence™ – the TattleTale™ Graph!
The TattleTale lets users know when and how many times their pet has entered the Avoidance Zone. By tracking the frequency and timing of these ‘boundary challenges,’ pet parents can spot potential distractions – like a neighbor’s dog or a school bus – and address them right away.
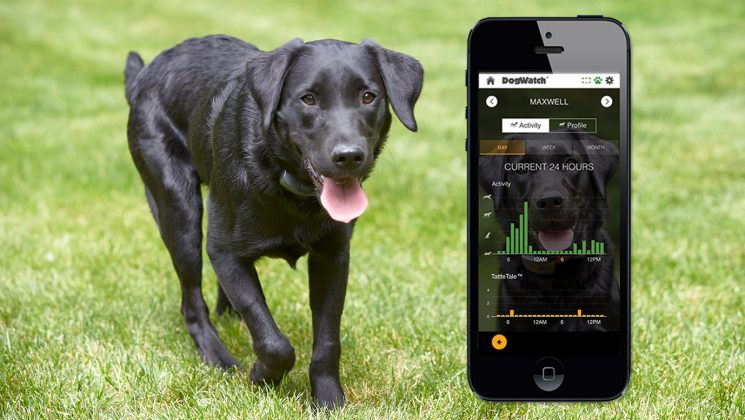
Located below the Activity Graph, the TattleTale indicates how many ‘warnings’ (audible and/or correction) a dog has received and when the ‘warning’ occurred. The graph shows up to four warnings per hour.

This sample TattleTale Graph for “Maxwell” (above) shows two boundary challenges in one 24 hour period: one at 7PM and another at 10AM. Maxwell’s parents now know to watch for distractions which may be tempting their pup (such as the mailman at 10AM?).
SmartFence users may have already noticed the TattleTale Graph below their pet’s Activity Graph. If not, go ahead and take a look! If your pet’s TattleTale Graph is flat, you can be confident that your pet is not challenging her boundaries, even if that squirrel or neighbor’s dog tempts her.
If you have any questions about the new TattleTale™ Graph, contact your local DogWatch Dealer today!